Search Your Query

Custom Search

Friday 20 May 2011

MJoy- USB video game controller


Not a real project this time, most likely an implementation of another person project.
If you like to play videogames in your computer as much as I do, you probably already heard about the MJoy, which is an USB joystick made by Mindaugas that uses an ATmega8 and have 24 buttons, one hatswitch (or POV or D-Pad depending on the game) and 6 analog axes.
100_5385
It’s oriented to flight simulators games, but can be used for any game, it’s should work wonderfully if you are trying to build a MAME cabinet (Uh, I might try that later).
And it can do that with really simple components, just some resistors, 12 MHz crystal, zener diodes and some diodes to prevent phantom keys (and of course, an ATmega8).
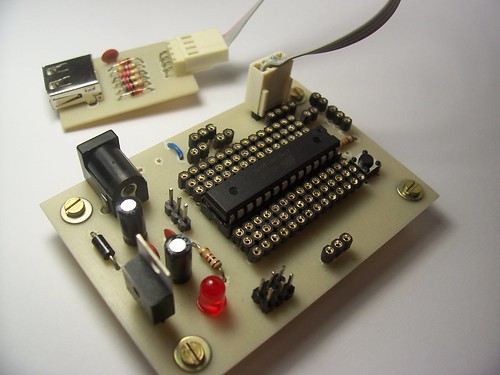
Anyway, since I was already etching the beta board myself, I made a little board for this implementation.
100_5382
But this part is so simple that you can do it in a protoboard or perfboard.
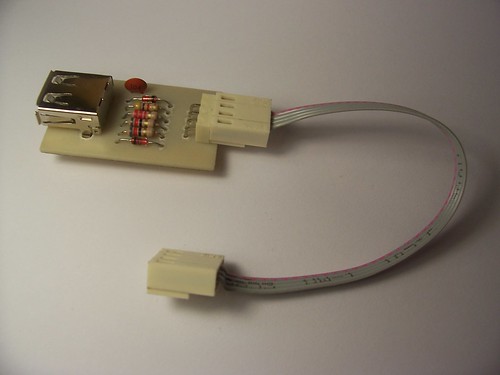
And I know, I know, I should use a B USB connector since it’s a downstream device, but I couldn’t find one, so I used a female A USB connector and a male-to-male A cable.
Unfortunately, Mindaugas site was been down for ages, and people who wish to build one depend on web.archive or the first version of the project, since its still on its original place.
So I will post the code here, but as soon as the site is back I will remove it.
I used the alternative version, made by LazyCamel, but you can try any version to see if it works for you (aren’t you glad now that I put that general purpose connector on the beta card?).
Just put a 12 MHz crystal in the connector in the beta card, 22pF ceramic capacitors in the crystal capacitors place (if you don’t know here it is, just click in the top view photo of the beta card and then see the notes on flickr), always remember to connect Agnd to ground and Vref and AVcc to the positive power supply before you program the code.
Connect the ground on the USB board with the ground on the beta board, same with the 5V, then connect -D to pin 2 on the ATmega8 and +D to pin 3 and 4.
Program the code and then program the fuses, MJoy suggest that you should only program the SPIEN fuse, I suggest that you program the CKOPT fuse to, so it should something like this on PonyProg.
That should be it.
Any doubt, take a look at the schematics that LazyCamel made, there is even a board there, so you shouldn’t have any problems.
The code in hex from LazyCamel
The pdf from LazyCamel with the schematics and the board that he made.
The schematics and the board file in eagle format with the B-female USB connector.
The schematics and the board file in eagle format with the A-female USB connector.

The 
schematics in PNG.
The board is released as-is under
Creative Commons 3.0 - Attribution - Share Alike

Measuring Heart Rate on LCD using PIC

Project management: Sinan Aziret, Bernard Herrmann, Michael Scheible 
Support and editing: Albrecht Kettler

Introduction

The human heart can be measured optically. The varying with the heartbeat blood pressure leads to an optically measurable change in blood content of the peripheral vessels. This can be detected as well on the finger. 
We had two project work available, which had progressed so far that the optical pulse signal detected on a LCD screen could be displayed graphically. Both works have been realized with a microcontroller PIC16C74 to sensing and visualization of the measurement signal. The summer semester 1999 the work performed had two different approaches:

Pulse measurement in the transmitted light


As light source a red, super bright LED was used. The finger penetrating light was detected with a light frequency converter TSL230. The period of the signal of the TSL230 was detected using the capture unit of the microcontroller with an accuracy of 15 bits. Digital filters are 50Hz noise is suppressed and the extracted pulse signal.

Pulse measurement in reflection

To illuminate the skin surface, an infrared LED was used. The backscattered light was detected with a PIN photodiode. By an analog filter circuit constant light and high frequency noise were eliminated. The pulse signal was digitized by the A / D converter of the microcontroller with 8 bits.The aim of the project work described here to determine the pulse rate and their numerical representation was on a LC-display with the graphical representation of the pulse signal. 

Requirements and selection of measurement method

The results of the project work described here is to create a exhibit that showcases the optical measurement of heart rate as an example of opto-electronic circuits in a public showcase. The following requirements must be met, therefore:
  •  Insensitive to shock and carelessness by users
  •  No contact with live parts of the user
  •  Battery operation
  •  Same supply voltage of all components
  •  Graphical representation of the pulse signal suitable for different pulse amplitudes
  •  Numerical output of pulse frequency on graphic display
  •  Possibility to connect a PC's via the RS 232 interface
We opted for the method of pulse measurement in reflection, since the structure can be made more mechanically robust and can be installed between the sensor and finger an insulating Plexiglas. 


Tasks

The following tasks had to be solved:

Signal processing and frequency measurement

  • Reading of the pulse signals
  • Transfer of the raw pulsed signals to the LCD display
  • Transfer of the raw pulsed signals to the PC
  • Detection of the pulse edges
  • Calculating the pulse rate
This task was carried out by Sinan Aziret and Bernard Herrmann.

Programming LCD output

  • Conversion of the binary number to decimal
  • Power-on and initialization of the LCD
  • Text and numbers to the LCD
This task was performed by Michael Scheible. 

Hardware block diagram and interface description


Figure 2: Block diagram of the hardwareThe hardware interfaces, the following tasks
  • Detection of the pulse signal
  • - The detection of the pulse signal is carried by an array of IR LED and PIN photodiode  - To gain and filtering the detector signal, a circuit existing uses
  • Conversion of the analog pulse signal
  • - Pulse signal levels of 0V to 5V  - A / D values ​​from 0 to 255  - A / D converter range of 0V to 5V  - A / D conversion every 10 ms 100 Hz sampling frequency   
  • LCD display
  • - Continuous delivery of the raw A / D values ​​to LCD via ports B and D  - Transfer of the calculated pulse rate on an 8-bit binary register [1/min]  - Passing a pulse rate only if a correct pulse signal
  • Data transmission PIC16C74 - PC
  • - Transmission via the serial interface (RS 232)  - Transmission rate of 9600 bps (baud rate)  - Only continuous transmission of the raw A / D values

Considerations for determining the pulse rate

The optically detected pulse signal, although periodically, but is subject to variation. On the one hand, the pulse rate is not completely constant, on the other hand, it is mainly by movement of the finger to signal fluctuations. The pulse amplitude can vary greatly from subject to subject. Even when it comes to the same person by different blood flow and various degrees of pressing of the finger to significant changes in signal amplitude.An obvious solution for frequency measurement would be to identify the fundamental frequency of the signal by Fourrieranalyse. Sufficient for this purpose, however, the computing capacity of the microcontroller is not enough. It was therefore looking for ways to make do with less computing power. The basic idea was to recognize outstanding points in the curve of the pulse signal. Here there are at maxima and minima or inflection points.
The course of the pulse signal is shown schematically in Figure 3. (The LCD display of the waveform is inverted.) Typical is particularly the steep climb with a clearly pronounced first maximum, which may at the falling edge of a secondary maximum heart rate (due to the contraction of the second chamber of the heart) follows. 

Pulse detection by detecting the signal maxima

For a given curve by formula y = f (t) is obtained by searching for maxima zeros of the first derivative y 'where the second derivative y''less than zero. If the shape of a curve given by discrete samples, takes the place of the derivative as an approximation of the difference quotient. This is when the curve passes through a maximum, only very rarely be exactly zero. A better criterion is the zero crossing of the difference ratios of positive to negative values. 


3: "Determination of the" 1 Inference about  
          Three sampling intervals
To increase the numerical accuracy, it can be useful not determine the difference of consecutive values ​​directly but over several sampling intervals of time. The influence of measurement value variations due to noise and interference is reduced.

Figure 4: Detection of the maximum as  
Zero crossing of the "1.Ableitung"
To ensure that in fact only the main maximum is determined, one needs a further criterion. First, wait until the difference quotient a (empirically to be determined) threshold value. Then the following on this event zero crossing of the difference quotient is awaited, who then serves as the main maximum.

Pulse detection by detecting the turning point of the rising pulse edge


Figure 5: "2.Ableitung," Detection of  
Turning point of the steep rising edge
The turning point of the rising pulse edge is characterized by a maximum of the first derivative, indicated by a zero crossing of second derivative from positive to negative values. In practical implementation, again the difference quotient takes the place of discharge. Again, it is useful to first-order difference quotients over several sampling intervals of time to determine. seen as an additional criterion for actually the turning point of the steep rising pulse edge, it is required that the first derivative (the difference quotient) at the point of the inflection point is greater than a threshold value to be determined empirically.
Since the turning point of the rising pulse edge a clearly distinct and constant feature of the pulse signals of different subjects is, we chose the second method. 


Measuring the frequency

The display of heart rate in beats per minute is to take place. A count for one minute of time would take too long, so it makes more sense to calculate the frequency of the period. To increase the numerical accuracy, two signal periods for frequency calculations. This also allows comparison of two sequentially determined period lengths a simple plausibility check whether there is a correct pulse signal.The digitization of the pulse signal by the internal A / D converter of the PIC16C74. The A / D conversion is all controlled ms 10, the 16-bit timer and the compare unit of the microcontroller triggered by. The Grenfrequenz the filter / amplifier circuit is approximately 40 Hz, 100 Hz sampling frequency so that the Shannon's sampling theorem is satisfied with one. 


Description of the software to determine the pulse rate

Main program


Figure 6: Structure chart of the main program
The reading of the analog data is done in a timed interrupt routine that displays the main program by a flag bit when a new measured value is reached. The measured value is first passed to the LCD-display routine and plotted. Then, the measured value via the serial interface as is passed to a PC. In the next sub-program measurements are in a "software shift register buffer" and the first and second "derivative" is determined. From the discharges determined the following subroutine whether the turning point of the rising pulse edge was reached.


Subroutine scan (A / D values ​​in for y ', y'') form

7: "scan" signal flow of the subroutine The difference between the A / D values ​​represent an approximation for the 1.Ableitung y '. To increase the numerical accuracy and noise suppression is one difference, as shown above, across three sampling intervals. It must, therefore, the last four measurements (W1 to W4) are stored. The second "derivative" is formed from two successive values ​​of the first, therefore, only two derivative values ​​(W5 and W6) are stored. In order to determine a zero crossing of the second "derivative" may need two consecutive values ​​(W7 and W8) are thus saved.


In edge detection program


Figure 8: Structure chart of the subroutine "Flad"
When edge detection is first checked whether the "first derivative" is above a fixed predetermined threshold. If this is the case will determine whether a zero crossing of the "second derivative" of positive to negative values ​​is present. If it meets the turning point of the rising pulse edge was detected. The last determined period duration is stored. The new period in multiples of 10 ms Abstastintervalls results from the number of A / D conversions since the last detected edge. (The counter is set upon detection of a new edge to zero.)The new period is compared to the last measured. If the difference is less than 1 / 8 (12.5%) of the last measured period, a subroutine for calculating the pulse rate is called. To determine the pulse rate, the average of T0 and T1 is used.
Assembler source code of the program for pulse measurement

View the determined pulse rate on a LCD screen


Figure 9: Character set
Basic routines for driving the LCD display were already available. Already in previous projects in the summer of 1999, the pulse signal was plotted. In addition, to be placed in the calculated heart rate [1/min] on the LCD display to display. For this, the binary number must be passed first in a decimal (BCD) representation are changed. 
Since the LCD display has a character generator, letters and numbers must be generated in software. The figure shows the pixel matrix of the characters to be displayed that is stored in the EEPROM of the microcontroller as a table. (See details below)

Specifications of the LCD display (NLC 128x064CSC)

The display is an LCD display with STN-technology. The resolution is 64 x 128 dots. The dot size is 0.48 mm x 0.48 mm, the spacers are the size of 0.04 mm x 0.04 mm. Thus we come to a total size of 0.52 mm x 0.52 mm. The backlighting is done via a yellow LED's. 
More technical data of the LCD displays are shown in the following table: 


Table 1: Specifications of the LCD display

 Figure 10: Power supply  
               LCDs


Construction of the LCD display

In the case of displays, the two required for the activation of matrix LCD pixel 64 channel segment driver IC are integrated. These IC's include one with 512 bytes of RAM and the digital logic that is both necessary for an 8-bit microcontroller to exchange data and other, in order to realize the imperative need for LCD displays AC voltage control. The control of the entire display is via two ports of the PIC. Port B is used to transmit 8-bit data words, while Port D provides some control signals. This pinout is shown in the following table: 

Table 2: Connection of the LCD to the microcontroller PIC16C74On port B, both the actual graphics files by bytes transferred to the display and status information (busy, On / Off, Reset) of the display to be read by the PIC. Port D is always connected as the output. Due to the layout of the display area in two 64 x 64 pixels halves, each managed by an LCD driver (KS0108B) must, on port D is one of two drivers using the "chip select" signals CS1 and CS2 are selected. The following figure shows the pixel regions of the two LCD parts are shown in more detail. This information is needed to address the respective display area. In the graphic representation of the pulse signal Y represents the time axis dar. 

Figure 11: Pixel Addressing

How to program the LCD output

An overview of the commands for controlling the LCD driver ICs are the following:
Table 3: Control of the LCD controller
Based on the chip select signals CS1 and CS2 must first be selected, the desired LCD controller chip. As can be seen from the table above shows the line D / I on whether instructions or display status information or data (pixels) are transferred. The direction of data transfer is determined by the R / W line. The transfer of data or instructions is triggered by the enable line. When switching from high to low takes the LCD controller data. It has been shown that waiting times at different points (realized by NOP instructions) are required which are not mentioned in the datasheet of the LCD controller. 
After reading or writing data automatically display the Y address counter is incremented by one.
To graphics data output to the display, proceed as follows:
Initialization
First, both LCD driver chips are reset (reset). This is done in the subroutine "LcdInit. Then both drivers in the ON mode can be switched, "lcdon" what happens in the subroutine. Now the display (the RAM memory of the driver) will be deleted. This happens because the entire video memory is overwritten by the two drivers with 0 (switched-off pixels). The subroutine "lcdclrx" done so.
Output of graphics data
Thus at a particular point of the display one byte (8 bits correspond to 8 graphic pixels) can be issued, must be defined before the desired position in the form of x-and y-address. The subroutine "setaddrx" is responsible. According to Table 3 for this purpose must be first ensured that the drivers in the instruction mode (D / I = 0) and in write mode (R / W = 0) and y is selected according to the desired address of the correct driver
(For y = 0 .. 63 CS1 must be 1 and y = 64 .. 127 must CS2 = 1sein) The y-address, the bits DB7 DB6 = 0 and = 1 The bits DB5 to DB0 contain the actual y-address (0 .. 63). When addressing the bits x = 1 DB7, DB6 = 0, DB5, 4,3 = 1 and DB2 contain up DB0 are the actual x-address (0 .. 7).
Now the graphics data to be transferred. The R / W line is set to 0 for writing. Only his D / I must be 1, so that the driver understands the data to Port B as graphic data.
Combination of text and graphics:
Text to be displayed only in Page 1. Page 2 to Page 8 stand for the Graphical Darstellng of the pulse signal. The developed in previous projects program for graphic edition put out at each measurement represented an entire column (Pages 1 to 8) of the display. The delete function has been limited for the new program to Pages 2 to 8. The recorded measurements are scaled to ensure that the picture will not overwrite the text area.
Text output on the LCD
Since the display has no built-in character generator, must the text to be passed in the form of graphics data. To do this, as mentioned above, the text zones are transferred to columns in a table. The table is in the program memory of the PIC using the commands retlw B'XXXXXXXX applied ', accessed by a jump can be defined. 
The table is the sign: "P" "U" "L" "S" "" "" and must include the numbers 0 through 9 and a heart symbol. 


12: pixel matrix shown in PIC assembly language as a table
In the figure above assembler is an example of the heart symbol, the relationship between pixel matrix and the representation of the corresponding table shown in PIC. It should be noted that the display, the bits of a byte ascending left to right in a column of orders, shown above as is. The PIC instruction retlw B ' D7, D6, D5, D4, D3, D2, D1, D0 ', however, the bits of their value just the other way arranged accordingly. Therefore, the bits flipped in the table are stored.
The program section of text output consists of three parts: the table, the subroutine "txt" and the subroutine call is issued with each subroutine call the appropriate character from the table at any y-coordinate. 
The output of a character is as follows: 
First, the variable "offset" is specified at which position in the table presents the data for the desired character (for example, 8 for the number 1). With the variable "Y" set in which y-coordinate of the text to be displayed. (Since only output to Page 1 essay no need to specify an x-coordinate.). This is followed by the call of the subroutine "txt". The subroutine "txt" reads one after the 8 columns that are needed to represent a character from the table and outputs them to the display.
The transferred as binary pulse is first converted into a BCD representation. Since the character table starts with zero and each character is 8x8 pixels in size, the values ​​for the units, the tens and the hundreds simply multiplied by 8 to determine the address offset from the pixel matrix for each point found in the table. For example, this would be at a unit digit of 4: 4x8 = 32 (position 32 in the table).
Related Posts Plugin for WordPress, Blogger...